How Can You Download Your Home Energy Data in CSV Format?
Downloading home energy data in CSV format allows you to analyze your household consumption patterns, identify cost-saving opportunities, and track your progress toward energy efficiency goals. The process involves accessing your utility provider’s online portal or smart home energy management system, locating the data export feature, selecting your desired date range, and choosing CSV as your file format. Most major utility companies and smart home platforms now support CSV exports, making it easier than ever to take control of your energy data. Once downloaded, you can import this data into spreadsheet applications like Microsoft Excel or Google Sheets for detailed analysis, create custom reports, or integrate it with third-party energy management tools. This comprehensive guide will walk you through the specific steps, common platforms, and best practices for downloading and utilizing your home energy data in CSV format as of April 2026.
What Are the Main Sources for Home Energy Data Downloads?
Your home energy data can come from several sources, depending on your setup and location. Understanding these sources helps you know where to look when you need to export your information.
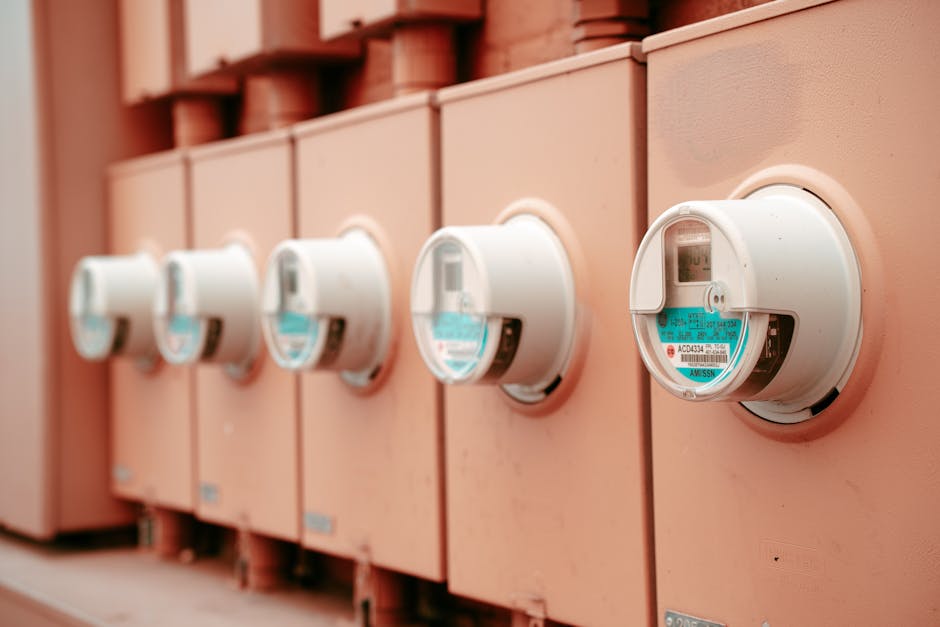
Utility Company Portals
Most electric, gas, and water utility companies now offer online customer portals where you can view and download your usage data. These portals typically provide hourly, daily, or monthly consumption records. Major utilities including Duke Energy, Southern California Edison, and Con Edison have implemented data download features in compliance with utility regulations. To access your utility portal, log in with your account credentials, navigate to the usage or billing section, and look for an export or download option. Some utilities may require you to enable data sharing first, which can usually be done in your account settings. The data from utility portals is often the most accurate source since it comes directly from your meter readings.
Smart Home Energy Management Systems
If you have a smart home energy monitor or management system installed, these devices track real-time energy consumption with greater granularity than utility meters. Systems like Tesla Powerwall, Sense Energy Monitor, and Emporia Vue provide detailed breakdowns by circuit or appliance. These platforms typically offer more frequent data points—sometimes every minute—compared to utility portals. Smart home systems usually have their own apps or web interfaces where you can export data directly. The advantage of these systems is that they often provide appliance-level insights, helping you understand which devices consume the most energy. This data is particularly useful for identifying specific areas where you can reduce consumption.
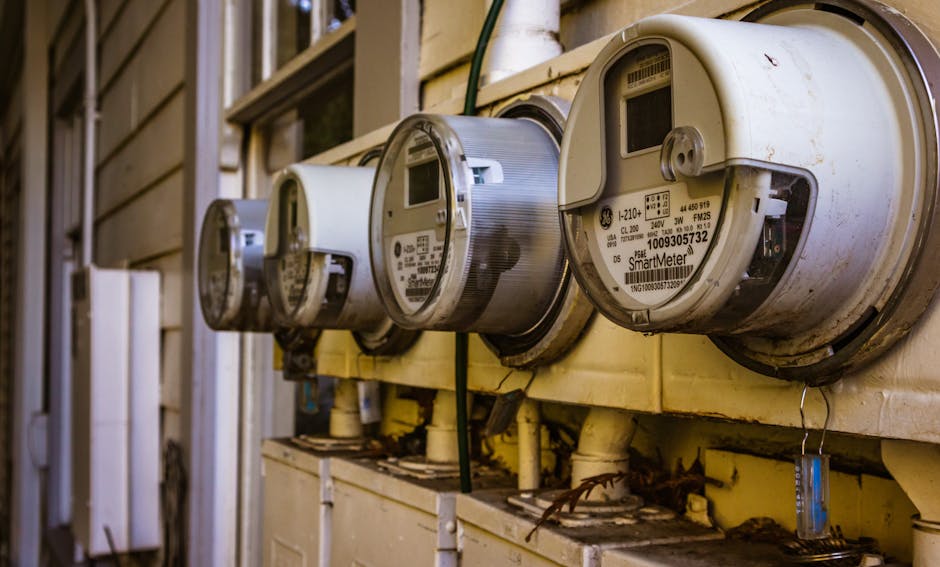
Smart Meter Advanced Metering Infrastructure (AMI)
Advanced Metering Infrastructure represents the newest generation of utility meters deployed across North America. These smart meters communicate directly with utility companies and often provide near real-time consumption data. According to the U.S. Department of Energy, over 100 million smart meters have been deployed in the United States. Many utilities with AMI systems allow customers to access their data through dedicated portals or third-party applications. Some utilities participate in data sharing programs that allow you to grant permission for authorized apps to access your energy data automatically, which can streamline the download process significantly.
How Do You Access Your Utility Company’s Data Export Feature?
Accessing your utility company’s data export feature requires navigating their online portal system. While each utility has slightly different interfaces, the general process follows a consistent pattern that most customers can complete in under ten minutes.
Step-by-Step Portal Navigation
First, visit your utility company’s official website and log into your customer account using your username and password. If you don’t have an online account, you’ll need to create one—this typically requires your account number, which appears on your utility bill. Once logged in, look for sections labeled “Usage,” “Consumption,” “Energy Usage,” “My Data,” or “Bills & Usage.” These sections are usually found in the main navigation menu or under an account settings area. Click on the usage section to view your consumption history. Most utilities display data in graph or table format showing daily, weekly, monthly, or annual consumption. Look for buttons or links that say “Download,” “Export,” “Download Data,” or “Get My Data.” Some utilities may require you to accept data sharing terms before enabling downloads, so check for any consent checkboxes or agreements that need approval.
Selecting Your Date Range and Format
After clicking the export option, you’ll typically see a dialog box asking you to specify your desired date range. Most utilities allow you to download anywhere from one month to several years of historical data, though some may limit free downloads to the past 12-24 months. Select your start and end dates carefully—downloading too much data at once may cause processing delays, while downloading in smaller chunks (3-6 months at a time) often works more reliably. Next, you’ll be asked to select your preferred file format. Choose CSV (Comma-Separated Values) from the available options. CSV is the most universally compatible format and works with virtually all spreadsheet and data analysis applications. Some utilities may also offer Excel (.xlsx), JSON, or XML formats—CSV is typically the best choice for maximum compatibility and ease of use.
Completing the Download
After selecting your format, click the download or export button. Depending on the amount of data you’re requesting, the download may start immediately or you may receive a notification that the file is being prepared. Large data requests sometimes require the utility to compile the information, which can take anywhere from a few seconds to several hours. You should receive a confirmation email with a download link if the file isn’t immediately available. Once the download completes, the CSV file will appear in your computer’s default download folder. Before proceeding with analysis, verify that the file downloaded completely and isn’t corrupted by opening it in a text editor or spreadsheet application to confirm it contains data and proper formatting.
What Are the Best Practices for Exporting and Organizing Your Energy Data?
Properly exporting and organizing your energy data ensures you can effectively analyze it and maintain accurate records over time. Following these best practices will save you time and prevent data loss or confusion.
Creating a Consistent File Naming System
Develop a clear naming convention for your downloaded files that includes the utility name, date range, and export date. For example: “ElectricUsage_Jan2026-Mar2026_ExportedApril2026.csv” or “GasConsumption_2025Annual_April2026.csv.” This naming system makes it easy to locate specific time periods and understand at a glance what data each file contains. Avoid generic names like “data.csv” or “download.csv” because you’ll quickly accumulate multiple files that become difficult to distinguish. If you download data regularly, consider including a version number (v1, v2, etc.) if you export the same period multiple times, as utilities sometimes update historical data after corrections or meter recalibrations.
Organizing Files in Folders
Create a dedicated folder structure for your energy data to maintain organization. A logical structure might be: Energy_Data > 2026 > Electricity or Energy_Data > 2026 > Natural_Gas. Alternatively, organize by utility company if you have multiple providers. Within each folder, you can further organize by year, quarter, or month depending on how frequently you download data and how detailed your analysis needs to be. Keep all related files together—if you download the same time period from multiple sources (utility portal and smart home system), store them in the same location with clearly differentiated filenames so you can compare the data. This organization system becomes invaluable if you need to reference historical data months or years later.
Backing Up Your Data
Energy data represents a valuable historical record of your household consumption patterns. Back up your downloaded CSV files to a cloud storage service like Google Drive, Dropbox, OneDrive, or iCloud to prevent data loss from computer failures or accidental deletion. Cloud backup also allows you to access your data from any device and share it with contractors, energy auditors, or family members if needed. Consider creating an automated backup schedule if your cloud service supports it, so new downloads are automatically backed up without requiring manual action. Additionally, maintain at least one local backup on an external hard drive or USB drive stored in a safe location.
How Do You Export Data from Smart Home Energy Monitoring Systems?
Smart home energy monitoring systems provide more granular data than utility portals, often tracking consumption at the circuit or appliance level. The export process varies by system but generally follows similar principles to utility portals.
Exporting from Popular Energy Monitoring Platforms
Sense Energy Monitor, one of the leading home energy monitoring systems, allows users to export data through its mobile app or web dashboard. Log into your Sense account, navigate to the “More” or settings menu, and look for “Data Export” or “Download Data” options. Select your desired date range and choose CSV format if available. Sense typically allows downloads of up to one year of data per request. Emporia Vue, another popular system, provides data export through its web portal—access your account, go to the usage or history section, and select the export function. Tesla Powerwall users can access their energy data through the Tesla app, though CSV export options may be limited compared to dedicated energy monitoring systems; you may need to use third-party tools or APIs to export Powerwall data to CSV format. Always check your specific system’s documentation or support resources, as features and interfaces update regularly.
Using APIs for Advanced Data Access
Many modern smart home energy systems provide API (Application Programming Interface) access for advanced users who want to automate data collection or integrate with custom applications. APIs allow you to programmatically request your data and save it directly to CSV format without manually downloading through web interfaces. This approach is particularly useful if you want to collect data automatically on a regular schedule. To use an API, you typically need to register for a developer account, obtain API credentials (usually an API key), and use a programming language or tool to make requests to the system’s endpoints. Services like Zapier or IFTTT can sometimes facilitate API connections without requiring programming knowledge, allowing you to automatically export data to cloud storage services like Google Sheets or Dropbox. Consult your energy monitoring system’s developer documentation for specific API endpoints and authentication requirements.
How Do You Import and Analyze Your CSV Energy Data?
Once you’ve downloaded your home energy data in CSV format, the next step is importing and analyzing it to gain actionable insights about your consumption patterns and identify opportunities for improvement.
Importing CSV Files into Spreadsheet Applications
Microsoft Excel and Google Sheets are the most accessible tools for analyzing energy data. In Excel, open a new spreadsheet, click “File,” select “Open,” and choose your CSV file. Excel will automatically parse the comma-separated values into columns. In Google Sheets, click “File,” select “Open,” choose “Upload,” and select your CSV file. Google Sheets will similarly organize the data into columns and rows. After importing, review the data structure to ensure it imported correctly. Your CSV file should have columns for date/time, consumption amount, and potentially other fields like cost, temperature, or appliance-level breakdowns depending on your data source. If the data didn’t import correctly, you may need to adjust your import settings—most spreadsheet applications allow you to specify delimiters (comma, semicolon, tab) and other formatting options during import.
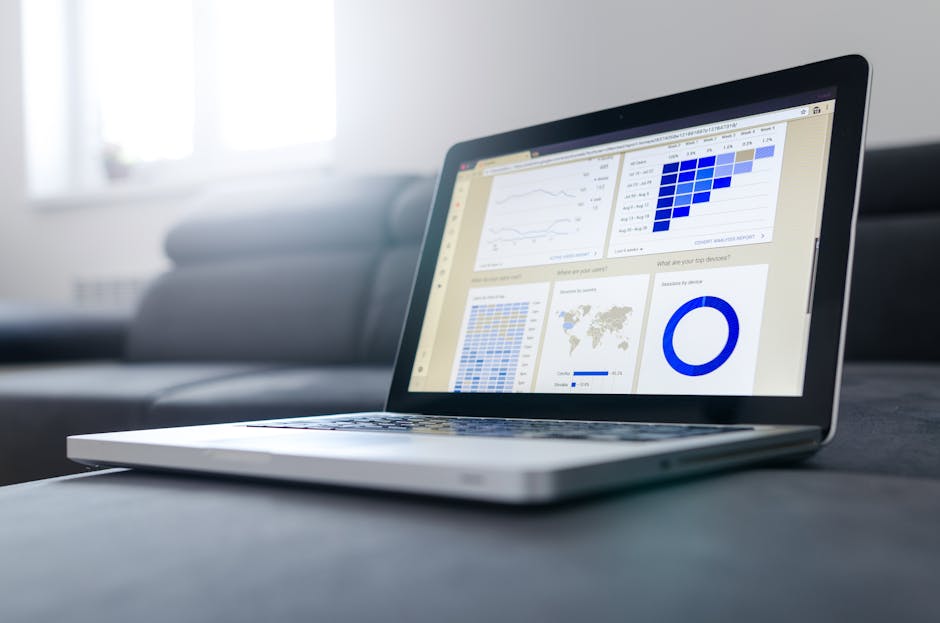
Creating Visualizations and Reports
Spreadsheet applications offer built-in charting tools that transform raw consumption data into visual representations. Create line graphs to show consumption trends over time, bar charts to compare consumption across different months or seasons, or pie charts to show the percentage breakdown of energy use by appliance or time of day. These visualizations make it much easier to identify patterns—for example, you might notice that your consumption spikes during summer months (air conditioning) or winter months (heating). Create summary statistics including average daily consumption, peak usage times, and month-over-month changes. Calculate your consumption in kilowatt-hours (kWh) per day or per square foot of living space to benchmark against regional averages. Many utility companies publish average consumption data for your area, allowing you to see how your usage compares to similar households. This comparison can motivate efficiency improvements and help you set realistic reduction targets.
Identifying Consumption Patterns and Anomalies
Analyze your data to identify when you use the most energy and which periods show unusual spikes. If you have appliance-level data from a smart home system, look for specific devices that consume disproportionate amounts of energy. Common energy hogs include HVAC systems, water heaters, refrigerators, and electric vehicles. Calculate the cost of operating each major appliance by multiplying consumption (kWh) by your utility’s rate per kilowatt-hour. This calculation helps you prioritize which appliances to upgrade or use more efficiently. Look for day-to-day or week-to-week variations that might indicate opportunities for behavior change. For example, if you notice higher consumption on weekends when more people are home, you might implement strategies to reduce usage during peak times. If you heat or cool your home, correlate your consumption data with outdoor temperature data to understand how weather affects your energy needs and identify potential issues with insulation or HVAC efficiency.
How Do You Prepare Your Energy Data for Advanced Analysis or Third-Party Tools?
CSV files can be imported into more sophisticated data analysis tools and energy management platforms to gain deeper insights. Preparing your data properly ensures compatibility and accuracy in these advanced applications.
Data Cleaning and Standardization
Before importing your CSV data into advanced analysis tools, review it for errors, missing values, or inconsistencies. Check that all dates are formatted consistently (for example, all using MM/DD/YYYY format) and that consumption values are in the same units (kWh, therms, or gallons). Some CSV files may have headers (column names) while others don’t—note this when importing into new applications. Remove any duplicate rows that might have resulted from multiple exports of overlapping time periods. If your data has gaps (missing days or hours), note where these gaps occur—they might indicate meter reading errors, system outages, or data transmission issues. Some analysis tools can interpolate missing values, but it’s better to understand the source of gaps before proceeding. Standardize any text fields (like appliance names or meter types) to ensure consistency—for example, use “Air Conditioning” consistently rather than mixing “AC,” “A/C,” and “air conditioning” in different rows.
Integrating Multiple Data Sources
If you download data from both your utility company and a smart home monitoring system, you may want to combine these datasets for comprehensive analysis. Create a master spreadsheet that includes data from both sources, using date/time as the common key to match records. The utility data provides accurate total consumption readings, while smart home data provides appliance-level breakdowns. By combining them, you can see both the big picture and granular details. Ensure that the time zones and timestamp formats match between sources before combining—time zone mismatches can create artificial discrepancies in your analysis. Calculate the difference between total consumption from your smart home system and utility readings to identify any unmonitored loads or measurement discrepancies. This comparison often reveals phantom loads (devices consuming power in standby mode) or loads from areas not covered by your smart home monitoring system.
Exporting to Third-Party Energy Management Tools
Many energy management platforms, sustainability tracking apps, and home automation systems can import CSV data. Popular options include EnergyHub, OhmConnect, and various utility-specific programs. Check whether these services accept CSV imports directly or require specific formatting. Most services provide documentation about required column headers and data formats. When exporting to third-party tools, verify that the service has appropriate privacy protections and clearly understands how your data will be used. Some services use your consumption data to optimize your home’s energy use automatically, while others simply provide analytics and reporting. Read privacy policies carefully before uploading sensitive consumption data. If a service requires authentication with your utility company or smart home system, using OAuth (a secure authentication standard) is safer than entering your passwords directly into third-party applications.
What Are Common Mistakes to Avoid When Downloading Home Energy Data?
Understanding common pitfalls helps you avoid problems and ensures your data analysis yields accurate results.
Downloading Incomplete or Overlapping Data
One frequent mistake is downloading data with gaps or overlapping time periods, which creates confusion during analysis. When downloading data in multiple sessions, keep careful track of which date ranges you’ve already downloaded to avoid duplicates. If you need to update your dataset with the most recent data, download only the new time period rather than re-downloading the entire history. Another common issue is not realizing that utility data is sometimes delayed—your utility portal might not show the most recent day or week of consumption because readings are processed with a lag. If you need current data, check when your utility updates their portal and plan your downloads accordingly. Some utilities update daily, while others update weekly or monthly.
Misunderstanding Time Zones and Daylight Saving Time
CSV files sometimes include timestamps in different time zones, particularly if your system spans multiple time zones or if you’re comparing data from different sources. Daylight Saving Time transitions can also create confusion—on the day clocks change, you might have 23 hours or 25 hours in a day depending on whether clocks spring forward or fall back. When analyzing hourly data, account for these time changes to avoid misinterpreting consumption patterns. Standardize all timestamps to a single time zone before combining data from multiple sources. If your data includes timestamps, verify whether they’re in local time, UTC (Coordinated Universal Time), or another standard.
Ignoring Data Quality Issues
Not all downloaded data is perfectly accurate. Utility meters can malfunction, smart home systems can lose connectivity, and data transmission can introduce errors. When you first import your CSV data, visually scan it for obviously erroneous values—consumption readings that are impossibly high or negative values where only positive consumption makes sense. Investigate spikes or drops in consumption that seem unusual. If you notice a day with zero consumption, it might indicate a meter reading failure rather than an actual outage. Contact your utility if you suspect data quality issues, as they may need to investigate meter problems or provide corrected readings. Don’t base important decisions on data you suspect is inaccurate.
Failing to Account for External Factors
Energy consumption varies based on weather, occupancy, and seasonal factors. A common analytical mistake is comparing consumption from January (heating season) directly to July (cooling season) without accounting for the different energy needs. Instead, compare January to January or use temperature-adjusted metrics. If you’re evaluating the effectiveness of an energy efficiency upgrade, ensure you’re comparing similar time periods and weather conditions. If you installed solar panels or made insulation improvements, note the installation date in your analysis so you can accurately attribute changes in consumption to specific interventions.
How Do You Use Energy Data to Identify Efficiency Improvements?
The ultimate goal of downloading and analyzing your home energy data is to identify opportunities to reduce consumption and lower your utility bills. Your CSV data can guide specific, targeted improvements.
Benchmarking Against Regional Averages
Start by comparing your consumption to regional benchmarks. The U.S. Energy Information Administration (EIA) publishes average residential energy consumption by state and region. If your consumption is significantly higher than the regional average for a similar-sized home, you likely have efficiency improvement opportunities. The EIA data is broken down by heating fuel type and climate region, allowing you to find a meaningful comparison. Online tools like the EPA’s Home Energy Yardstick or your utility company’s benchmarking program can provide more specific comparisons based on your home’s characteristics. If your consumption is already below average, focus on maintaining your efficiency rather than pursuing major upgrades.
Identifying Peak Usage Times and High-Cost Periods
If your utility offers time-of-use (TOU) rates, your CSV data becomes even more valuable. TOU rates charge different prices for electricity used during peak hours (typically afternoon and early evening) versus off-peak hours. Analyze your consumption patterns to see how much energy you use during peak versus off-peak periods. If you use significant energy during peak hours, you can reduce costs by shifting usage to off-peak times—running dishwashers and laundry at night, charging electric vehicles during off-peak hours, and adjusting thermostat settings during peak periods. Some utilities provide separate consumption data for peak and off-peak hours in their CSV exports, making this analysis straightforward. Even without TOU rates, understanding your peak usage times helps you plan efficiency improvements—if your peak is during summer afternoons, air conditioning efficiency becomes your priority.
Evaluating Specific Efficiency Improvements
Before and after analysis using your CSV data helps you quantify the impact of efficiency improvements. Record the date when you make changes (new HVAC system, insulation upgrade, water heater replacement, or behavioral changes), then compare consumption for similar time periods before and after the change. Account for weather differences using heating and cooling degree days, which are available from NOAA and other sources. This analysis helps you understand which improvements deliver the best return on investment. If you’re considering an expensive upgrade like a heat pump or solar panels, your historical consumption data provides the baseline needed to calculate payback periods and potential savings. Share this analysis with contractors or installers—they can use your actual consumption data to size equipment appropriately and estimate realistic savings.
Frequently Asked Questions
Can I download energy data from my utility if I don’t have an online account?
You’ll need to create an online account with your utility company to access their data download feature. Visit your utility’s website and select “Create Account” or “Register.” You’ll need your account number (from your bill), address, and other identifying information. Some utilities allow you to create accounts by phone if you prefer not to use their website. Once your account is activated, you can access the data export feature.
How far back can I download historical energy data?
Most utilities allow you to download data going back 12-24 months, though some offer longer histories. Smart home systems often retain data for several years. Check your specific utility or system’s terms to see how far back data is available. If you need historical data beyond what’s currently available, contact your utility’s customer service—they may be able to provide older data upon request, sometimes for a fee.
What if my CSV file won’t open in Excel or Google Sheets?
Try opening the file with a text editor first to verify it’s a valid CSV file. If it opens as readable text with comma-separated values, the issue is likely with how your spreadsheet application is interpreting the file. In Excel, use the “Text to Columns” feature to properly parse the data. In Google Sheets, try uploading the file again and manually specifying the delimiter (comma) during import. If the file appears corrupted or unreadable, try downloading it again from your utility or system.
Can I automate my energy data downloads?
Some utilities and smart home systems offer API access that allows automated downloads, but most require manual downloads through their portals. Third-party services like Zapier can sometimes automate the process by connecting your utility account to cloud storage. Alternatively, if your system supports API access, you can write a simple script to automatically download and save your data on a schedule. Check your utility or system’s developer documentation for automation options.
Is my energy data private when I download it?
Your energy data is personal information and should be treated as sensitive. When downloading data, ensure you’re using a secure internet connection (HTTPS, not HTTP). Don’t share your CSV files containing detailed consumption data with untrusted third parties. When uploading to cloud storage or third-party analysis tools, verify the service has appropriate security measures and privacy protections. Read privacy policies to understand how your data will be used.
What should I do if I notice errors in my downloaded energy data?
Contact your utility company’s customer service to report data discrepancies. Provide specific dates and consumption values that seem incorrect. Utilities can investigate whether the issue is a meter malfunction, data transmission error, or calculation mistake. They may provide corrected data or adjust your bill if errors are found. Keep records of your communications in case billing disputes arise.
Is Downloading and Analyzing Your Home Energy Data Worth Your Time?
Downloading and analyzing your home energy data in CSV format is absolutely worth the effort for most homeowners. The process typically takes just 15-30 minutes to complete the initial download and import into a spreadsheet, yet it provides valuable insights that can lead to significant utility bill reductions and increased comfort. By understanding your consumption patterns at a detailed level, you can identify which appliances consume the most energy, when you use energy most intensively, and how your usage compares to similar homes in your area. This knowledge enables you to make targeted, cost-effective improvements rather than guessing about where to focus efficiency efforts. According to the U.S. Department of Energy, behavioral changes alone can reduce energy consumption by 10-15%, while strategic upgrades can achieve even larger savings. The data-driven approach of downloading and analyzing your CSV energy data positions you to maximize these potential savings. If you’re already investing in smart home technology or considering energy efficiency improvements, your CSV data becomes an essential tool for measuring results and justifying investments. For those interested in broader smart home implementation, understanding your energy data is a crucial first step—learn more about building a smart home step by step or starting a smart home on a small budget to integrate energy monitoring with other home automation systems. The combination of energy data analysis with broader smart home control gives you comprehensive visibility and control over your household’s resource consumption, comfort, and costs.


Write Your Review
No reviews yet. Be the first to share your experience!