
How Can You Track Your Carbon Footprint on an Energy App in 2026?
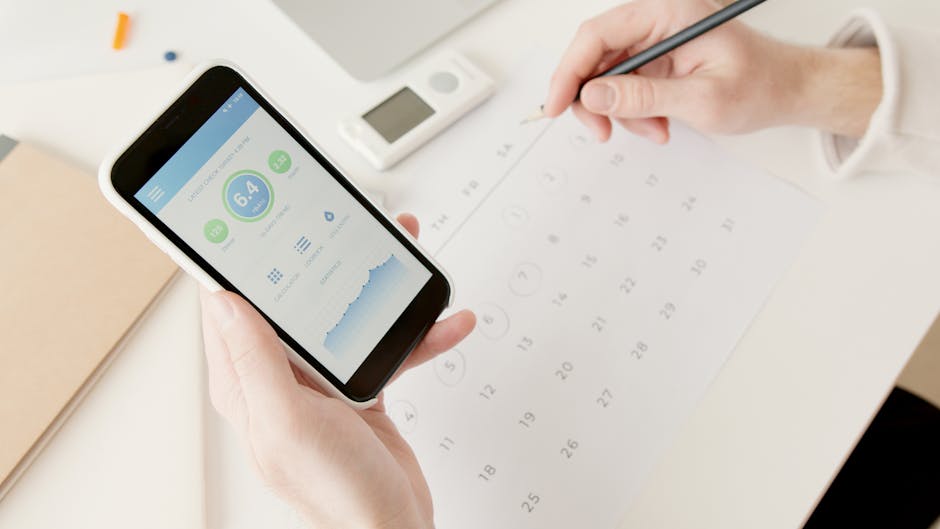
Tracking your carbon footprint on an energy app in 2026 has become essential for environmentally conscious households. The key takeaway is simple: modern energy apps automatically calculate your household’s carbon emissions based on electricity consumption and convert this data into actionable insights. Most energy apps in 2026 use your real-time power usage data to estimate CO2 emissions, typically ranging from 0.3 to 0.8 pounds of carbon dioxide per kilowatt-hour depending on your regional power grid composition. By connecting your smart meter, home energy monitor, or compatible smart home devices, these apps provide daily, weekly, and monthly carbon tracking reports. You can then compare your emissions against regional averages, set reduction targets, and receive personalized recommendations to lower your environmental impact. The integration of carbon tracking into energy apps represents a significant shift toward household sustainability accountability, allowing you to see the direct correlation between energy consumption and environmental harm. Understanding your carbon emissions empowers you to make informed decisions about appliance usage, renewable energy adoption, and peak-hour consumption patterns. This comprehensive approach to carbon monitoring transforms abstract environmental concerns into concrete, measurable data you can control and improve over time.
What Data Does an Energy App Use to Calculate Your Carbon Footprint?
Energy apps calculate your carbon footprint using several interconnected data sources. The primary input is your household’s electricity consumption measured in kilowatt-hours (kWh), which flows from your smart meter or energy monitoring device. This consumption data is then multiplied by your region’s carbon intensity factor—a metric that represents how much CO2 is produced per unit of electricity generated in your specific area. According to the U.S. Environmental Protection Agency (EPA), carbon intensity varies significantly across regions, ranging from as low as 50 grams of CO2 per kilowatt-hour in areas with substantial renewable energy generation to over 800 grams in regions relying heavily on coal-based power plants.
Advanced energy apps in 2026 also incorporate temporal factors into their calculations. They recognize that electricity generated during peak hours often comes from less efficient sources, while off-peak electricity may derive from renewable sources. Some premium apps factor in the specific fuel mix of your utility company, which can be obtained from U.S. Energy Information Administration (EIA) data. Additionally, if you have solar panels or other renewable energy sources, sophisticated apps subtract your renewable generation from your grid consumption to provide net carbon calculations. This granular approach means your carbon footprint reflects not just total energy use, but the actual environmental impact of the electricity sources powering your home. Understanding these calculation methodologies helps you interpret your app’s data accurately and identify which consumption patterns have the greatest environmental consequences.
How Do Regional Power Grid Factors Affect Your Carbon Calculations?
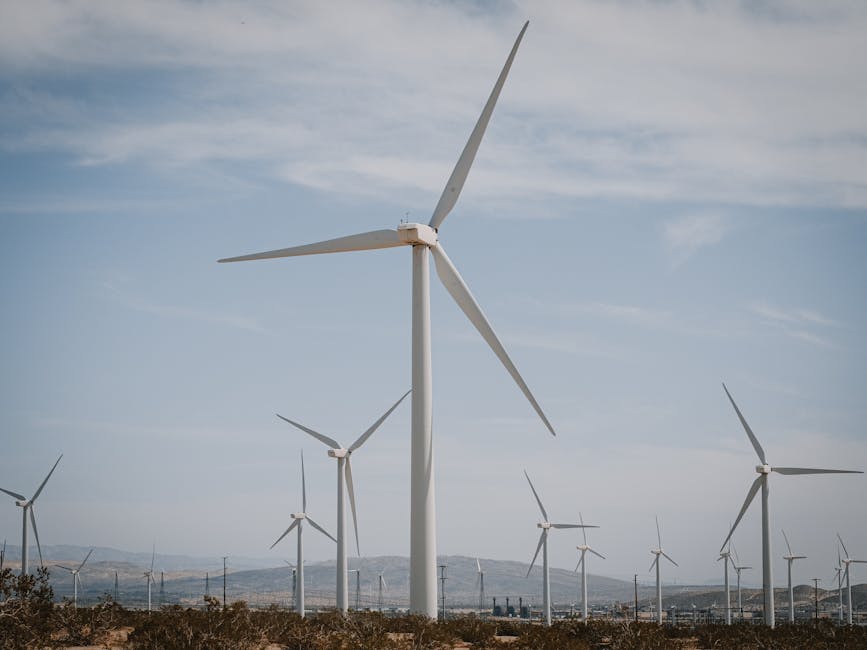
Your region’s power grid composition dramatically influences your carbon footprint calculations. If you live in an area where electricity comes primarily from renewable sources like wind or hydroelectric power, your carbon intensity factor will be significantly lower than someone in a region dependent on fossil fuels. For example, a household in Washington State, which generates much of its electricity from hydroelectric dams, will have a substantially lower carbon footprint per kilowatt-hour than an identical household in a coal-dependent region. Energy apps use regional emission factors provided by utility companies or environmental databases to ensure accuracy. When you set up your energy app, you’ll typically enter your zip code or utility provider, which automatically applies the correct carbon intensity factor. This regional personalization is crucial because it means your app’s carbon calculations reflect the actual environmental impact of your energy consumption in your specific location. Some apps allow you to track how these regional factors change over time, showing you when your grid becomes cleaner as renewable energy adoption increases in your area.
How Do You Connect Your Smart Meter and Devices to an Energy App?
Connecting your devices to an energy app requires several steps, beginning with choosing an app that supports your existing smart home infrastructure. Popular options in 2026 include apps from major utility companies, standalone energy management platforms, and smart home ecosystems like Home Assistant or Apple Home. The connection process typically starts by installing the app on your smartphone or accessing it through a web browser. Next, you’ll need to authorize the app to access your smart meter data through your utility company’s API (Application Programming Interface). Most utilities have customer portals where you can grant third-party applications permission to read your consumption data. This process usually involves entering your utility account credentials and confirming authorization.
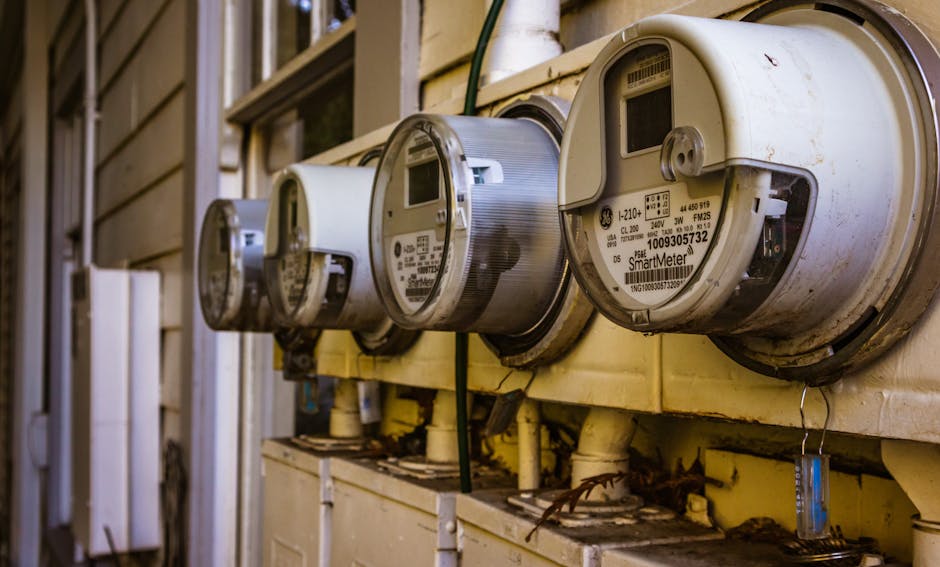
If you’re using a dedicated home energy monitor like the Aeotec Home Energy Meter or similar devices, you’ll need to connect these devices to your home network first. For a comprehensive guide on installation, refer to our article on how to install sensors on electrical service mains in 2026. Once your hardware is networked, you can add it to your energy app by scanning QR codes, entering device serial numbers, or connecting through your home automation hub. After successful connection, the app will begin receiving real-time or near-real-time data about your energy consumption. Most apps require 24 to 72 hours of data collection before they can generate meaningful carbon footprint reports, as they need sufficient consumption patterns to establish baselines and provide accurate calculations.
What Are the Different Connection Methods for Energy Apps?
Energy apps in 2026 support multiple connection methods to accommodate different household setups. Direct utility API integration is the most common method, where apps connect directly to your utility company’s servers to pull consumption data. This method requires you to create an account with your utility and authorize the app through your utility’s customer portal. It’s the most convenient option because it requires no hardware installation and provides official, accurate data directly from your meter. The second method involves connecting a dedicated energy monitoring device, such as a CT clamp energy monitor or whole-home energy meter, which you install on your electrical panel. For detailed installation instructions, see our guide on how to install CT clamps energy monitor in 2026. These devices transmit data wirelessly to a hub, which then communicates with your energy app. A third method uses individual smart plugs and appliance-level monitors that track specific devices. While this approach requires more setup, it provides granular insights into which appliances consume the most energy. Some advanced households combine all three methods for comprehensive carbon tracking at multiple levels—whole-home, room-level, and appliance-specific—allowing them to identify carbon reduction opportunities with precision.
What Features Should You Look for in a Carbon-Tracking Energy App?
When selecting an energy app for carbon footprint tracking in 2026, prioritize several key features that maximize the value of your monitoring efforts. First, look for real-time data visualization that shows your current power consumption and carbon emissions as they happen. This immediate feedback is psychologically powerful—seeing your carbon footprint increase in real-time when you turn on an air conditioner creates awareness that motivates behavioral change. Second, ensure the app provides historical trend analysis with daily, weekly, monthly, and annual comparisons. These trends help you identify seasonal patterns and measure the effectiveness of your reduction efforts over extended periods. Third, seek apps that offer appliance-level breakdown capabilities, showing you which devices consume the most energy and contribute most significantly to your carbon footprint. For appliance-specific tracking, our guide on how to track energy use per appliance in 2026 provides comprehensive instructions.
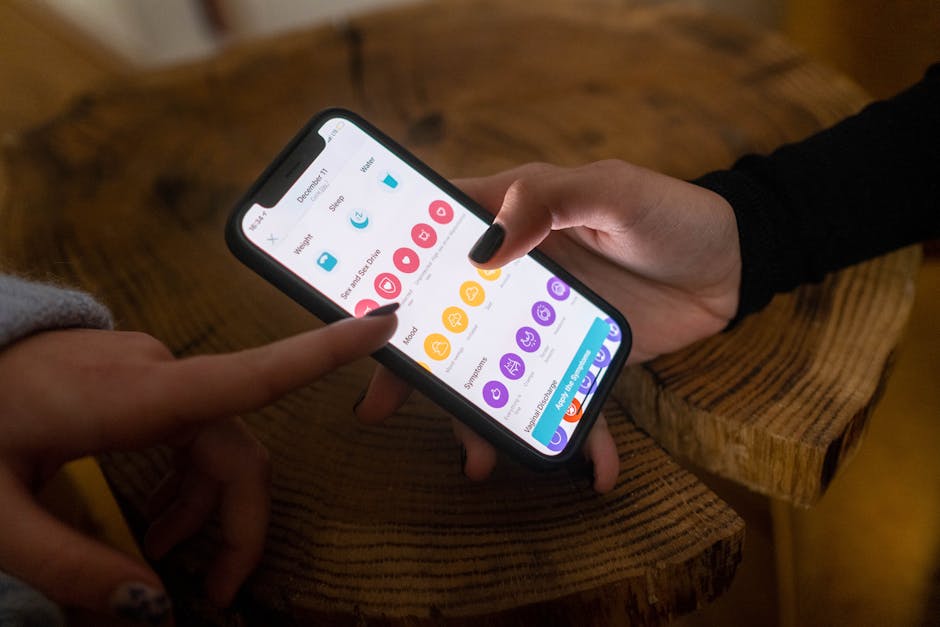
Fourth, choose an app that includes benchmarking features, allowing you to compare your carbon footprint against similar households, neighborhood averages, or regional standards. This social comparison element often motivates greater reduction efforts. Fifth, look for goal-setting functionality where you can establish carbon reduction targets and track progress toward them. Sixth, verify that the app provides personalized recommendations based on your consumption patterns—for example, suggesting that you shift dishwasher usage to off-peak hours. Our article on how to automate dishwashers for off-peak hours in 2026 explains how to implement such strategies. Finally, ensure the app integrates with your smart home system if you have one, allowing you to automate adjustments based on your carbon footprint goals. Apps that offer carbon offset information, renewable energy incentives, or connections to local solar installation services add additional value by helping you move beyond consumption reduction to clean energy adoption.
How Can You Reduce Your Carbon Footprint Using Energy App Insights?
Once you’re tracking your carbon footprint through an energy app, the real work begins: using those insights to reduce your environmental impact. Start by identifying your consumption patterns through the app’s historical data analysis. Most households discover that heating and cooling account for 40-50% of their carbon footprint, water heating adds 15-20%, and appliances contribute the remaining 30-40%. By understanding your specific breakdown, you can prioritize reduction efforts where they’ll have the greatest impact. If heating and cooling dominate your footprint, focus on thermostat optimization, weatherization, and equipment upgrades. If appliances are the culprit, explore the strategies outlined in our guide on how to reduce standby power phantom loads in 2026, which addresses the often-overlooked energy waste from devices in standby mode.
Next, implement time-shifting strategies using your app’s consumption timing data. If your app shows that you’re using significant electricity during peak hours when your grid relies on fossil fuels, shift discretionary loads to off-peak periods when renewable energy is more available. Many energy apps now include automated scheduling features that align your appliance usage with cleaner grid periods. For guidance on setting up automation, refer to our article on how to set up automated lighting schedules in 2026, which demonstrates scheduling principles applicable to various appliances. Additionally, use your app to monitor the impact of behavioral changes in real-time. Reduce phantom loads by unplugging devices, adjust thermostat settings by just a few degrees, or eliminate unnecessary appliance usage—then watch your carbon footprint decrease in the app. This immediate visual feedback creates powerful motivation for sustained behavior change. Finally, consider renewable energy adoption. If your app shows you’re generating excess solar energy during peak production hours, you’re already reducing your carbon footprint. For optimization strategies, see our article on how to maximize self-consumption of solar energy in 2026.
What Troubleshooting Steps Should You Take If Your Energy App Isn’t Tracking Correctly?
If your energy app isn’t displaying carbon footprint data or shows inaccurate readings, start with basic troubleshooting. First, verify that your app has successfully connected to your data source. Check your utility account’s connected applications section to confirm the app still has authorization. Utility companies sometimes revoke app access due to password changes or security updates, which breaks the connection without notifying you. Second, ensure your smart meter or monitoring device is functioning properly. For smart meter connection issues, our comprehensive guide on how to troubleshoot smart meter connection in 2026 provides detailed diagnostic steps. Third, verify that your app is using the correct regional carbon intensity factor. Check your app’s settings to confirm your utility company and region are properly configured, as incorrect regional settings will produce inaccurate carbon calculations.
Fourth, check if your app requires a minimum data collection period before displaying carbon calculations. Most apps need at least 24-48 hours of consumption data to generate meaningful reports. If you’ve recently connected your app, wait a few days and check again. Fifth, clear your app’s cache and force-refresh the data. Many apps include a manual refresh button that forces immediate data synchronization with your utility or monitoring device. Sixth, verify that your smart home devices are properly identified within the app. If you’ve recently installed new appliances or changed device configurations, update your app’s device inventory to ensure accurate appliance-level tracking. Finally, contact your energy app’s customer support if problems persist. Provide them with screenshots of the issue, your utility provider information, and your app version number. Most reputable energy apps maintain active support teams to resolve data synchronization and calculation issues.
How Do You Set and Achieve Carbon Reduction Goals Using Your Energy App?
Setting meaningful carbon reduction goals transforms your energy app from a passive monitoring tool into an active change agent. Begin by establishing your baseline carbon footprint using your app’s historical data. Calculate your average monthly carbon emissions over at least three months to account for seasonal variations. Once you have this baseline, set a realistic reduction target. Industry experts recommend targeting a 10-15% reduction over 6-12 months as an achievable initial goal. More ambitious households might aim for 20-30% reductions by combining behavioral changes with equipment upgrades. Enter these goals into your energy app if it has goal-setting functionality. Apps that support goals typically allow you to specify your target date and track progress with visual indicators like progress bars or percentage completion displays.
To achieve your goals, break them into specific, actionable steps. If your app shows that heating accounts for 45% of your carbon footprint, your first goal might be reducing heating-related emissions by 20%. This translates to concrete actions like lowering your thermostat by 2-3 degrees, sealing air leaks, or upgrading to a more efficient system. Monitor your app daily during the first month of implementation to see immediate results from your changes. This frequent monitoring creates positive reinforcement and helps you identify which actions have the greatest impact. As you progress, gradually shift your focus to secondary consumption categories. If you’ve successfully reduced heating emissions, tackle appliances next. Many energy apps provide specific recommendations for the next reduction opportunity based on your consumption patterns, creating a guided pathway to your overall carbon reduction goal. Share your progress with household members to create collective accountability. Some apps include family features that show everyone’s contribution to household carbon reduction, turning sustainability into a household game with shared victory when goals are achieved.
What Role Do Energy Apps Play in Supporting Renewable Energy Integration?
Modern energy apps in 2026 play a crucial role in maximizing the environmental benefits of renewable energy systems like solar panels. If you have solar generation, your energy app should track both your consumption from the grid and your generation from renewable sources, calculating your net carbon footprint. This distinction is important because every kilowatt-hour you generate and consume locally (self-consumption) avoids grid electricity, which may come from fossil fuel sources. Advanced apps help you understand your solar generation patterns and consumption patterns to identify opportunities for better alignment. For instance, if your app shows you generate peak solar power at midday but consume most electricity in the evening, you’re missing opportunities for self-consumption. Our detailed guide on how to maximize self-consumption of solar energy in 2026 explains strategies to shift consumption toward peak generation times, thereby reducing your reliance on grid electricity and lowering your carbon footprint.
Energy apps also facilitate renewable energy decision-making. If your app shows you’re on track to reduce your carbon footprint to near-zero through behavioral changes and efficiency improvements, it provides data supporting the case for solar installation. Many apps include solar savings calculators that estimate how much carbon you could avoid by installing solar panels based on your specific consumption patterns and regional solar potential. Some premium apps even integrate with local solar installers, allowing you to request quotes based on your app’s data. Additionally, if you’re considering energy storage (batteries) to pair with solar panels, your app’s consumption timing data helps determine optimal battery sizing. By showing you when you use the most electricity, your app enables you to store solar energy during peak generation for use during peak consumption times, further reducing grid dependence and carbon emissions. This integration between consumption monitoring and renewable energy optimization creates a comprehensive sustainability strategy where data drives decision-making at every level.
Frequently Asked Questions
What is the average carbon footprint of a typical U.S. household?
The average U.S. household generates approximately 10-12 metric tons of carbon dioxide annually from energy consumption alone. This varies significantly by region, climate, household size, and energy sources. Households in colder climates typically have higher carbon footprints due to heating demands, while those with renewable energy sources have substantially lower emissions. Your energy app will show how your household compares to regional averages.
How often should you check your energy app for carbon tracking?
Check your energy app at least weekly to maintain awareness of your consumption patterns and carbon footprint trends. Daily checking during the first month of tracking creates strong awareness and motivation for change. After establishing baseline awareness, weekly reviews are sufficient to monitor progress toward goals and identify significant changes in consumption patterns that might require attention.
Can energy apps predict your future carbon footprint?
Advanced energy apps in 2026 use historical consumption data and weather forecasts to predict future carbon footprints. These predictions help you anticipate high-consumption periods and plan reduction strategies accordingly. Predictive features typically show estimated emissions for upcoming weeks or months based on seasonal trends and scheduled activities, enabling proactive rather than reactive energy management.
What’s the difference between carbon footprint and carbon emissions in energy apps?
Carbon footprint is the total amount of greenhouse gases produced by your household, while carbon emissions specifically refer to CO2 released. Energy apps typically use these terms interchangeably when discussing electricity-related impacts. Your app’s carbon footprint calculation is based on your electricity consumption multiplied by your regional grid’s carbon intensity factor, expressed in pounds or kilograms of CO2 equivalent.
How accurate are energy app carbon calculations?
Energy app carbon calculations are generally accurate within 5-10% when they use official utility data and current regional carbon intensity factors. Accuracy depends on whether your app uses real-time grid data versus average factors. Apps using real-time grid composition data from your utility are more accurate than those using annual averages, as grid carbon intensity varies hourly based on the mix of energy sources supplying power at any given moment.
Do energy apps work with all utility companies?
Most major energy apps work with large utility companies through API integrations, but coverage varies by region. Smaller utilities and rural areas may have limited app compatibility. Check your utility company’s website to see which third-party apps they support. If your utility isn’t supported, you can still track carbon by installing a dedicated home energy monitor that measures consumption directly at your electrical panel.
Is Tracking Your Carbon Footprint on an Energy App Worth the Effort?
Tracking your carbon footprint on an energy app in 2026 is absolutely worth the effort, both for environmental impact and personal benefit. The environmental case is straightforward: households that actively monitor their energy consumption and carbon emissions reduce their usage by 10-15% on average simply through awareness and behavioral change. This reduction directly translates to lower carbon emissions, contributing meaningfully to climate change mitigation when multiplied across millions of households. Beyond the environmental impact, carbon footprint tracking provides tangible personal benefits. You’ll likely reduce your energy bills proportionally to your consumption reductions, creating immediate financial incentive. Understanding your consumption patterns enables you to make informed decisions about major investments like HVAC upgrades, solar installation, or appliance replacements, ensuring these investments target your actual consumption patterns for maximum impact.
The process of tracking also creates psychological benefits often underestimated in sustainability discussions. Seeing your carbon footprint decrease in real-time as you implement changes provides powerful motivation for sustained behavior change. This differs fundamentally from abstract environmental concerns that feel too large to impact individually. Energy apps transform climate change from an overwhelming global problem into a personal, measurable challenge you can influence daily. Additionally, tracking your carbon footprint often leads to broader sustainability awareness. As you become conscious of your energy consumption, you may extend this awareness to water usage, waste generation, and consumer choices. Many households report that carbon footprint tracking serves as a gateway to comprehensive sustainability practices. In 2026, energy apps have become sophisticated enough that setup requires minimal technical knowledge, and most provide valuable insights immediately upon connection. Given the combination of environmental impact, financial savings, and psychological benefits, tracking your carbon footprint through an energy app represents one of the highest-return sustainability investments a household can make. Start with your baseline, set a realistic initial goal, and let your app guide you toward a lower-carbon household.









Write Your Review
No reviews yet. Be the first to share your experience!