
What Is a Smart Home Energy Dashboard for Home Assistant and How Does It Work?
A smart home energy dashboard for Home Assistant is a centralized visualization interface that displays real-time and historical energy consumption data from your connected smart home devices in April 2026. The key takeaway is that it transforms raw energy data into actionable insights, allowing you to identify consumption patterns, detect energy vampires, and reduce utility bills through informed decision-making. Home Assistant, an open-source platform, aggregates data from smart meters, smart plugs, and connected appliances, presenting this information through customizable dashboards that update in real-time. These dashboards integrate with various energy monitoring integrations including Home Assistant’s official integrations, allowing you to track consumption by room, appliance, or time period. Unlike proprietary solutions, Home Assistant dashboards offer complete control over data privacy—all information remains on your local network rather than being transmitted to cloud servers. The dashboard functionality extends beyond simple monitoring; it enables automation triggers based on energy thresholds, cost calculations, and predictive analytics that help anticipate peak usage periods. By visualizing energy patterns, homeowners can make targeted improvements, whether upgrading to efficient appliances, adjusting thermostat settings, or eliminating phantom loads. The integration with Home Assistant’s broader automation ecosystem means your energy dashboard can trigger actions automatically, such as shifting heavy loads to off-peak hours or alerting you when consumption exceeds predefined limits.
What Components Do You Need to Build an Effective Energy Dashboard in Home Assistant?
Building a functional energy dashboard requires several essential hardware and software components working together seamlessly. The foundation starts with energy monitoring hardware—typically a smart meter integration, CT (current transformer) clamps, or smart plugs that measure consumption at different points in your home. Home Assistant itself serves as the central hub, running on hardware like a Raspberry Pi 4, Intel NUC, or dedicated appliance. For accurate whole-home monitoring, you’ll need a utility meter integration or sub-metering system that captures total consumption. Individual smart plugs provide granular data about specific appliances, helping you understand which devices consume the most energy. The software side requires Home Assistant installed with energy management integrations enabled, including the built-in Energy integration that Home Assistant introduced to streamline dashboard creation. You’ll also need a compatible database like InfluxDB or PostgreSQL for storing historical data, enabling trend analysis and long-term consumption tracking. Network infrastructure matters significantly—ensure stable Wi-Fi or Ethernet connectivity for all devices to maintain real-time data accuracy. Optional but valuable components include smart thermostats for HVAC monitoring, smart breakers for circuit-level tracking, and AI appliance recognition systems that automatically categorize consumption. Many users implement backup power solutions like UPS systems to ensure the Home Assistant hub remains operational during outages, preventing data gaps. The Matter protocol integration, increasingly important in 2026, provides enhanced interoperability between different manufacturer devices and Home Assistant, improving data collection reliability.
How Do You Configure Energy Monitoring Integrations in Home Assistant?
Configuring energy monitoring integrations in Home Assistant involves several sequential steps that build upon each other to create a comprehensive monitoring system. First, access Home Assistant’s settings menu and navigate to Devices & Services, where you’ll find the Energy integration under the official integrations section. The Energy integration acts as Home Assistant’s native energy dashboard builder, providing a user-friendly interface for connecting your various energy sources. Begin by adding your utility meter integration—this is typically done through YAML configuration or the UI, depending on your specific meter type and available integrations. If you’re using a smart meter provided by your utility company, check whether Home Assistant has a dedicated integration available; many utility providers now offer direct integrations through Home Assistant’s integration marketplace. For CT clamp-based monitoring systems, you’ll configure the sensors that read current flow and convert it to power consumption data. CT clamps require proper polarity configuration to avoid negative readings—ensure the clamp is oriented correctly around the wire, as reversed polarity will show inverted consumption data. Next, add individual device integrations by connecting smart plugs, smart switches, or smart appliances that report energy consumption. Each device requires proper authentication and connection to your Home Assistant network. Once sensors are added, navigate to the Energy section in Home Assistant’s settings to define your energy sources, adding each meter or sub-metering system. Then configure consumption categories—assign devices to rooms or appliance types like heating, cooling, lighting, or appliances. This categorization enables the dashboard to display consumption breakdowns by category, making it easy to identify which systems consume the most energy. Configure solar generation if you have photovoltaic panels, adding inverter data to track self-consumption and grid export. Finally, set your energy costs—input your utility rate structure, including tiered pricing if applicable, so Home Assistant can calculate financial impacts alongside consumption metrics. Test all connections to ensure real-time data updates appear in your dashboard within seconds of consumption changes.
What Are Common Mistakes When Setting Up an Energy Dashboard in Home Assistant?
Understanding common pitfalls helps you avoid time-consuming troubleshooting and ensure accurate energy monitoring from day one. The most frequent mistake is improper CT clamp installation, which causes negative readings and polarity issues that distort consumption data. CT clamps must be installed with correct polarity around the wire; reversed installation shows inverted consumption figures that confuse analysis. Another common error involves incomplete sensor configuration—users add hardware but fail to properly expose sensors to Home Assistant, resulting in missing data points. Ensure all energy-reporting devices are properly configured in Home Assistant’s YAML or UI, with correct entity IDs and data types specified. Many users overlook database configuration, relying on Home Assistant’s default statistics storage which has limitations for long-term historical analysis. Implementing InfluxDB or PostgreSQL from the start provides better data retention and query capabilities. Failing to set accurate utility rates is another critical mistake—if you don’t input correct pricing information, cost calculations become meaningless, defeating a primary purpose of energy monitoring. Some users create overly complex dashboards with excessive detail that becomes difficult to interpret; start simple with key metrics, then add complexity as needed. Neglecting network stability causes data gaps when devices lose connection intermittently; ensure robust Wi-Fi coverage or use wired Ethernet for critical sensors. Users often forget to calibrate smart plugs or meters against known consumption values, leading to systematic errors in all measurements. Finally, many people add too many integrations simultaneously without testing each one individually, making it difficult to identify which integration causes problems if issues arise. Start with one energy source, verify it works correctly, then progressively add additional monitoring points.
How Do You Design an Effective Energy Dashboard Layout for Maximum Insight?
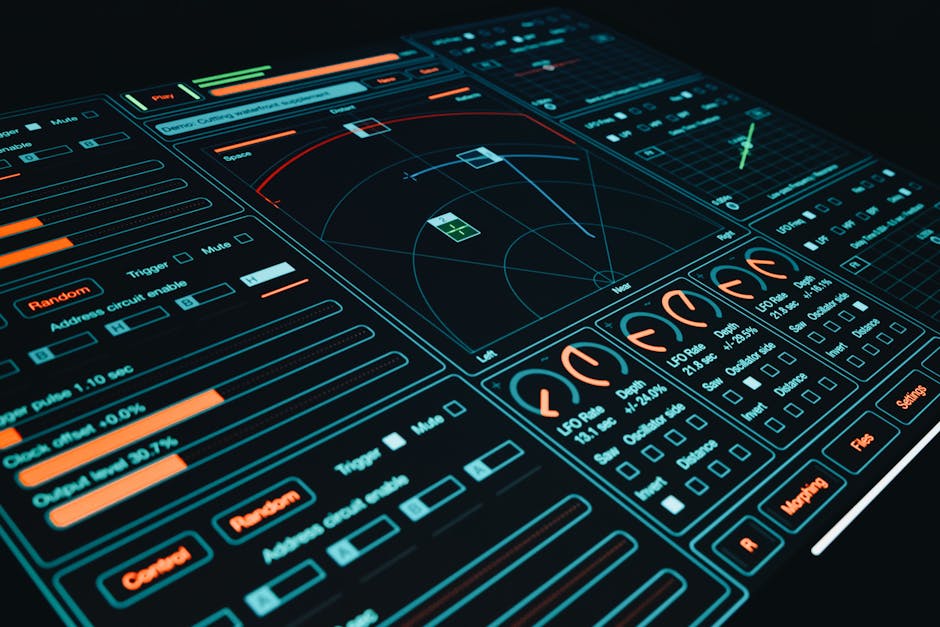
Dashboard design significantly impacts your ability to quickly understand energy patterns and identify optimization opportunities. Start by establishing a clear visual hierarchy with your most important metrics prominently displayed—typically total current consumption, daily cost, and comparison to previous periods. Use Home Assistant’s dashboard editor to create custom layouts; the native Energy integration provides a pre-built dashboard, but you can customize it extensively using the Lovelace UI. Begin with large, easy-to-read cards showing real-time power consumption in watts or kilowatts, updated every few seconds to reflect immediate changes. Add a cost card displaying today’s expense and projected monthly cost based on current usage patterns. Include consumption breakdown by category—separate cards for heating/cooling, lighting, appliances, and other major systems help identify which areas consume most energy. Implement time-series graphs showing hourly or daily consumption patterns; these reveal peak usage times and help correlate consumption with activities or weather conditions. Add comparison cards showing current consumption versus the same period last week, month, or year—this contextualizes whether your usage is improving or increasing. For homes with solar generation, display production versus consumption side-by-side, showing self-consumption percentage and grid export. Create separate dashboard views for different purposes: one for quick daily overview, another for detailed analysis, and a third for automation and control. Use conditional formatting and color coding—green for low consumption, yellow for moderate, red for high usage—to quickly identify problem areas. Include cards for individual high-consumption appliances or rooms, allowing drill-down analysis. Add automation status cards showing active efficiency rules, scheduled load shifting, or demand response participation. Consider mobile-responsive design since you’ll likely check your dashboard from phones and tablets. Implement time range selectors allowing quick switching between hourly, daily, weekly, and monthly views. Finally, add predictive cards showing forecasted consumption based on weather, scheduled events, or machine learning models—these enable proactive energy management rather than reactive monitoring.
How Do You Integrate Smart Plugs and Connected Devices for Granular Energy Tracking?
Granular energy tracking through individual smart plugs and connected devices provides the detailed consumption data necessary for effective optimization. Each smart plug acts as a sub-meter, measuring power consumption for the specific appliance it powers. In Home Assistant, add smart plugs through the Devices & Services section, selecting the appropriate integration for your plug model—common options include Shelly plugs, TP-Link Kasa, Sonoff, and others. Verify that your chosen smart plugs report energy consumption (measured in kilowatt-hours) in addition to instantaneous power (measured in watts); not all smart plugs provide historical energy data. Once connected, Home Assistant automatically discovers the plug’s sensors, creating entities for voltage, current, power, and energy consumption. Assign each plug to a logical location and device category in Home Assistant—for example, label a kitchen outlet as “Coffee Maker” or “Refrigerator” rather than generic names. This categorization enables the Energy integration to automatically sort consumption by device type. For appliances without built-in smart capabilities, use smart plugs to add monitoring—this is particularly valuable for identifying phantom load energy vampires that consume power in standby mode. Smart plugs reveal which devices waste energy unnecessarily, enabling targeted interventions like unplugging devices or implementing automation to cut power during idle periods. Connect smart thermostats to track heating and cooling consumption separately; these devices typically report HVAC energy usage directly to Home Assistant. For larger appliances like water heaters, electric vehicle chargers, or pool pumps, dedicated smart breakers or sub-meters provide more reliable data than smart plugs. Create automation rules triggered by consumption thresholds—for example, alert you if the refrigerator’s power draw exceeds normal levels, indicating potential mechanical failure. Use smart plug data to identify peak consumption periods for specific appliances, then shift their operation to off-peak hours when electricity rates are lower. Implement smart plug automation to schedule non-essential devices during optimal times. Regularly review individual device consumption reports to identify aging appliances that consume excessive energy compared to modern alternatives—this data supports replacement decisions with clear ROI calculations.
What Automation Rules Should You Implement Based on Energy Dashboard Data?
Automation transforms your energy dashboard from a passive monitoring tool into an active energy management system that optimizes consumption automatically. The most impactful automation involves load shifting—scheduling high-consumption activities like laundry, dishwashing, or electric vehicle charging during off-peak hours when electricity rates are lowest. Home Assistant can automate these tasks based on time-of-use rates provided by your utility; configure automations that delay washer or dryer operation until after-peak hours, potentially saving 20-40% on energy costs for these appliances. Implement demand response automations that reduce consumption when utility signals indicate grid stress or peak pricing periods. Many utilities in 2026 offer real-time pricing APIs that Home Assistant can integrate with, enabling dynamic automation based on current electricity rates. Create temperature setpoint automations that adjust thermostat settings based on occupancy, time of day, or outdoor temperature—this single automation often reduces HVAC energy consumption by 10-15% without sacrificing comfort. Implement smart lighting automation that turns off lights in unoccupied rooms and adjusts brightness based on natural daylight availability, reducing lighting energy consumption by 30-50%. Add phantom load elimination automations that cut power to devices in standby mode during nighttime hours or when the home is unoccupied. For homes with battery storage or electric vehicles, implement charging optimization automations that prioritize charging during periods of maximum solar generation or lowest electricity rates. Create alert automations that notify you when consumption exceeds daily budgets or when specific appliances show unusual consumption patterns indicating malfunction. Implement water heating optimization automations that adjust water heater temperature or disable heating during peak hours. For homes with multiple heating zones, create occupancy-based automations that heat or cool only occupied areas, reducing HVAC energy waste. Add weather-based automations that close blinds during hot afternoons to reduce cooling load, or open them during sunny winter days to maximize passive solar heating. Implement smart plug automation that disconnects entertainment systems, game consoles, and other entertainment devices when not in use, preventing idle power consumption. Finally, create seasonal automations that adjust all energy-saving rules based on the time of year—summer automations focus on cooling efficiency, winter automations on heating optimization. Test each automation individually to ensure it functions correctly before enabling multiple automations simultaneously.
How Do You Troubleshoot Energy Dashboard Data Accuracy Issues?
Accurate energy monitoring requires systematic troubleshooting to identify and resolve data integrity issues. Start by comparing Home Assistant energy readings against your utility bill for the same period; significant discrepancies indicate calibration or configuration problems. If readings are consistently off by a percentage, check whether your smart meter or CT clamp requires calibration adjustment—many devices allow manual calibration to match known consumption values. For CT clamp systems, verify correct polarity installation as reversed clamps show inverted (negative) readings; if you observe negative values, reinstall the clamp with opposite orientation. Check whether all expected devices are reporting data to Home Assistant; missing device data creates incomplete consumption pictures. Use Home Assistant’s developer tools to inspect individual sensor values, ensuring they update in real-time and show reasonable values for connected devices. Verify database connectivity if you’re using InfluxDB or PostgreSQL; disconnected databases cause data loss and gaps in historical records. Examine network connectivity for wireless devices; intermittent Wi-Fi connections cause sporadic data reporting and missing consumption records. For smart meters provided by utilities, confirm that Home Assistant’s integration is properly authenticated and authorized to access consumption data; some utilities require periodic re-authentication. Check Home Assistant’s logs for integration errors or warnings that indicate problems with specific devices or sensors. If solar generation data is inaccurate, verify that your inverter integration is correctly configured and that the inverter reports data in the expected format. Compare consumption readings across multiple overlapping monitoring points—if a CT clamp reading differs significantly from smart plug readings of the same circuit, investigate potential measurement errors. Implement manual consumption checks periodically: turn off all major appliances and note the baseline consumption, then turn on individual devices to verify their reported consumption matches expected values. If smart plugs show inconsistent readings for the same device at different times, they may require replacement as internal measurement components degrade. Check whether Home Assistant’s Energy integration has been updated recently, as updates sometimes change how sensors are processed or calculated. Finally, document your troubleshooting findings and create a calibration baseline—this reference point helps identify future data drift and supports quick problem diagnosis.
What Advanced Features Can Enhance Your Energy Dashboard in 2026?
Advanced features transform basic energy monitoring into sophisticated energy management systems. Machine learning-based consumption prediction analyzes historical patterns to forecast future consumption, enabling proactive optimization before peak periods occur. Home Assistant integrates with machine learning models that predict heating and cooling demand based on weather forecasts, allowing thermostats to pre-condition homes efficiently. Artificial intelligence appliance recognition automatically categorizes consumption by device type without manual configuration; this technology has improved significantly in 2026, with AI appliance recognition now achieving high accuracy in identifying specific devices from consumption signatures. Integration with vehicle-to-load (V2L) technology allows electric vehicle batteries to power your home during peak pricing periods, creating a distributed energy storage system. If you have an EV with V2L capability, Home Assistant can automate charging and discharging based on electricity rates and home consumption needs. The Matter protocol, increasingly important in 2026, provides improved interoperability between different manufacturer devices, enabling seamless integration of previously incompatible equipment. Implement demand flexibility programs where Home Assistant automatically participates in utility demand response initiatives, reducing consumption during grid stress periods in exchange for bill credits or lower rates. Integration with battery storage systems enables sophisticated energy arbitrage—charging batteries during low-rate periods and discharging during high-rate periods to minimize overall costs. Advanced analytics dashboards display consumption correlations with external factors like weather, occupancy patterns, or grid carbon intensity, revealing optimization opportunities. Implement carbon footprint tracking that displays not just energy consumption but also associated CO2 emissions, helping environmentally conscious homeowners make informed decisions. Integration with smart thermostats enables demand-controlled ventilation that adjusts air exchange rates based on occupancy and CO2 levels, reducing heating and cooling load. Implement real-time grid carbon intensity integration that automatically shifts consumption toward periods when the electrical grid relies more on renewable energy sources. Create predictive maintenance automations that flag appliances showing declining efficiency, indicating they need service or replacement. Finally, implement peer comparison features that show your consumption relative to similar homes in your area, providing motivation for continued efficiency improvements.
How Do You Monitor Energy Efficiency Improvements Over Time?
Tracking efficiency improvements provides motivation and validates whether optimization efforts actually reduce consumption and costs. Home Assistant’s Energy integration automatically generates comparison reports showing current consumption versus previous periods—use these built-in reports as your primary efficiency tracking tool. Create custom dashboards displaying year-over-year consumption comparisons, which account for seasonal variations and provide clearer efficiency trend data. Calculate efficiency metrics like consumption per square foot or consumption per degree-day, normalizing for home size and weather variations. Implement baseline tracking where you document consumption during a reference period, then compare all subsequent periods against this baseline. If you made significant home improvements like insulation upgrades or appliance replacements, establish new baselines after improvements to measure their impact accurately. Track consumption by category over time—if HVAC consumption decreased 15% year-over-year while appliance consumption remained constant, you’ve identified successful optimization in one area. Create monthly or quarterly efficiency reports summarizing consumption trends, cost changes, and identified optimization opportunities. Use these reports to prioritize future improvements based on where the greatest savings potential exists. Implement cost tracking alongside consumption tracking; sometimes consumption decreases slightly while costs increase significantly due to rate changes, or vice versa. Monitor individual device efficiency by tracking smart plug consumption over time; if a refrigerator’s energy draw increases gradually, it may indicate declining efficiency requiring servicing. Compare actual consumption against predicted consumption based on weather and occupancy patterns; significant deviations indicate changes in behavior or equipment efficiency. Celebrate efficiency wins by documenting specific improvements—when you install a smart thermostat, measure its impact on heating and cooling consumption. Share efficiency improvements with household members, creating accountability and motivation for continued conservation. Use efficiency data to support decisions about major investments like solar installation or battery storage; clear consumption baselines and reduction trends make ROI calculations more accurate. Finally, use your efficiency tracking data to identify and determine optimal numbers of smart home devices needed to achieve your efficiency goals—not every device provides equal value, and tracking helps identify the highest-impact investments.
Is a Smart Home Energy Dashboard Worth the Investment in 2026?
A smart home energy dashboard for Home Assistant represents a worthwhile investment for most homeowners, particularly those committed to reducing energy consumption and utility costs. The financial return depends on several factors: your current energy consumption, local electricity rates, and your willingness to act on dashboard insights. For homeowners with high energy consumption or living in areas with expensive electricity, the dashboard typically pays for itself within 12-24 months through identified and implemented efficiency improvements. The non-financial benefits are equally significant—dashboards provide peace of mind through real-time monitoring, enable detection of equipment failures before they cause major damage, and support environmental goals by making energy consumption visible and actionable. The open-source nature of Home Assistant means you avoid ongoing subscription fees charged by proprietary energy management platforms, reducing long-term costs. Data privacy is a major advantage; all your consumption information remains on your local network rather than being transmitted to cloud servers where it could be sold to third parties or used for targeted marketing. Home Assistant’s flexibility allows you to start with basic monitoring and progressively add advanced features as your comfort with the system grows, spreading costs over time. The dashboard serves as the foundation for broader home automation—once you’ve invested in sensors and integrations for energy monitoring, you can leverage the same infrastructure for comfort, security, and convenience automations. The learning curve is moderate; users with basic technical skills can set up functional dashboards within a few hours, while more complex configurations require additional time investment. For renters or those planning to move within 2-3 years, the ROI may be lower since you can’t take permanent improvements with you, though portable devices like smart plugs retain value. The psychological benefit of visible energy consumption often motivates conservation behavior changes that persist over time, creating ongoing savings even without technological optimizations. In 2026, with improving integrations, better hardware options, and increased utility support for smart home integration, the value proposition has strengthened considerably compared to previous years. Most energy efficiency experts recommend that homeowners serious about reducing consumption implement some form of energy monitoring; Home Assistant’s dashboard approach offers the best combination of cost, flexibility, and control for technically-inclined users.
FAQ
What hardware do I need to run Home Assistant for energy monitoring?
Home Assistant runs on Raspberry Pi 4 or newer, Intel NUC, or dedicated appliances like the Home Assistant Green. You’ll also need energy monitoring hardware like smart plugs, CT clamps, or a smart meter integration. A reliable network connection and sufficient storage for historical data are essential. Most setups cost $200-500 for core hardware.
How accurate are Home Assistant energy readings compared to utility meters?
Properly configured Home Assistant systems typically achieve 95-99% accuracy compared to utility meters. Accuracy depends on correct CT clamp polarity, proper sensor calibration, and stable network connectivity. Regular comparison against utility bills helps identify and correct any systematic measurement errors or calibration drift.
Can I integrate my smart thermostat with Home Assistant energy monitoring?
Yes, most modern smart thermostats integrate with Home Assistant. Smart thermostats like Amazon’s model with Alexa Hunches can report HVAC consumption and respond to automation commands. Check your thermostat manufacturer’s Home Assistant integration availability before purchasing.
What’s the difference between a CT clamp and a smart plug for energy monitoring?
CT clamps measure current flow in large circuits and provide whole-home monitoring, while smart plugs measure individual appliances. CT clamps are better for circuit-level tracking; smart plugs are better for identifying consumption by specific device. Most comprehensive systems use both for layered monitoring.
How do I prevent negative readings in my CT clamp energy data?
Negative readings occur when CT clamps are installed with reversed polarity around the wire. Reinstall the clamp with the opposite orientation to fix the issue. Ensure the clamp’s arrow or marked side points in the correct direction relative to power flow through the wire.
Can Home Assistant energy dashboards help reduce my electricity bill?
Yes, dashboards typically reduce bills by 10-30% through identified efficiency improvements and behavior changes. The exact savings depend on your current consumption, local rates, and implemented optimizations. Most users see measurable savings within 3-6 months of active dashboard use.





Write Your Review
No reviews yet. Be the first to share your experience!